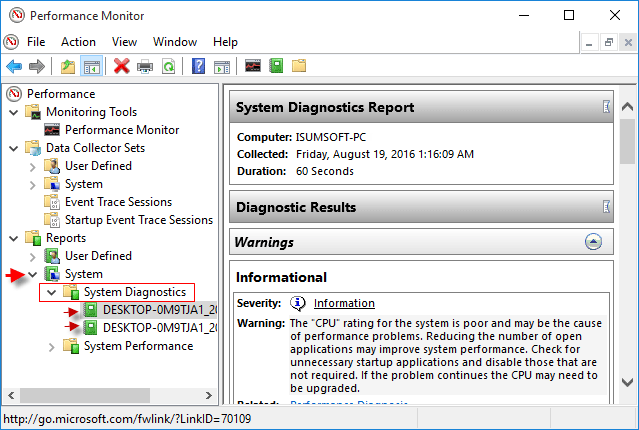
JAKARTA, cssmayo.com – System Diagnostics Best Practices: Optimizing Performance and Identifying Issues isn’t just a bunch of jargon, trust me. In my years diving into Techno troubleshooting, I can’t count how many times a simple missed step—like not checking RAM usage—turned a minor hiccup into an all-nighter. Let’s not make that mistake again, alright?
System diagnostics is the art and science of inspecting, measuring, and interpreting the health of your IT environment. From pinpointing CPU bottlenecks to unearthing misconfigured services, a systematic approach keeps systems running smoothly and prevents minor anomalies from becoming major incidents. Below, discover definitions, historical milestones, key principles, real-life lessons, actionable best practices, and the tools you need to diagnose issues effectively.
What Is System Diagnostics?

System diagnostics encompasses the procedures and tools used to:
- Monitor system resources (CPU, memory, disk, network)
- Analyze logs, metrics, and traces to detect anomalies
- Perform health checks on applications, databases, and infrastructure
- Correlate symptoms with root causes for faster resolution
A solid diagnostics workflow moves beyond reactive fixes to proactive capacity planning and risk mitigation.
Why It Matters for Performance and Reliability
- Reduces unplanned downtime and service interruptions
- Improves user experience by maintaining consistent response times
- Enables data-driven capacity planning and cost control
- Drives continuous improvement through trend analysis
- Empowers teams with early warnings, avoiding firefighting
Timeline: Evolution of Diagnostics Tools
| Era | Milestone | Impact |
|---|---|---|
| 1980s | top, vmstat, iostat on UNIX | Command-line resource snapshots |
| 1990s | MRTG for network traffic graphing | Visualized bandwidth trends |
| Early 2000s | Nagios and Zabbix emerge | Centralized alerting and plugin ecosystems |
| 2010s | Prometheus and Grafana | Pull-based metrics collection and customizable dashboards |
| Late 2010s | Distributed tracing (Jaeger, Zipkin) | End-to-end request path visibility in microservices |
| 2020s | APM & AI-driven diagnostics (New Relic, Datadog) | Intelligent anomaly detection and root-cause hints |
Core Principles & Frameworks
- Observability over Monitoring
- Collect metrics, logs, and traces to reconstruct system behavior.
- Baseline and Thresholds
- Establish normal operating ranges for resources; alert on deviations.
- Correlation and Context
- Link spikes in CPU or I/O to specific application events or deployments.
- Automation and Alerting
- Automate health checks and define actionable alerts (avoid “alert fatigue”).
- Continuous Feedback Loop
- Use post-mortems to refine diagnostics workflows and update runbooks.
Real-Life Insights: My Lessons from the Field
- Don’t trust defaults: out-of-the-box dashboards often miss key metrics. I custom-tuned my JVM-heap and garbage-collection graphs after a production outage.
- Log levels matter: verbose logging in prod can hide critical WARN/Error entries. I switched to structured logging with severity filters, slashing noise by 70%.
- Correlate releases with spikes: a memory leak after a feature deployment eluded me until I overlaid deploy timestamps on memory-usage charts.
- Probe from multiple vantage points: testing only from within the data center missed a DNS issue affecting external users.
- Validate alert pipelines: an SMTP outage silenced critical alarms—now I use multiple alert channels (Slack + SMS).
Best Practices for Effective System Diagnostics
- Define Service-Level Indicators (SLIs) and Objectives (SLOs) to drive meaningful alerts.
- Instrument code with custom metrics (e.g., request latency, queue depth).
- Centralize logs with an ELK/EFK stack or managed service, and enforce structured JSON logs.
- Implement distributed tracing to map requests across microservices and detect slow dependencies.
- Aggregate dashboards by service tier (web, app, database) for rapid health overviews.
- Use anomaly detection (rolling windows, machine learning) to catch subtle regressions.
- Regularly review and tune alert thresholds based on seasonal or usage patterns.
Tools & Platforms
| Category | Examples | Key Features |
|---|---|---|
| Metrics & Monitoring | Prometheus, Datadog, New Relic | Time-series storage, alerting, dashboards |
| Log Aggregation | Elasticsearch, Splunk, Graylog | Full-text search, retention policies |
| Tracing | Jaeger, Zipkin, AWS X-Ray | Span visualization, service dependencies |
| Synthetic Monitoring | Pingdom, Uptrends | External probe for uptime and API checks |
| Configuration Mgmt | Ansible, Terraform | Ensures diagnostic agents are deployed |
Case Study: Diagnosing a Bottleneck in a High-Traffic Web Service
- Situation: Periodic 500 ms latency spikes during peak shopping hours
- Diagnostics Workflow:
- Captured application and JVM metrics with Prometheus
- Correlated latency spikes with increased GC pauses via Grafana overlays
- Verified heap fragmentation by analyzing heap histograms in VisualVM
- Tuned GC settings (switched to G1, adjusted pause-time goals)
- Deployed changes behind a feature flag; monitored before full rollout
- Outcome: Latency 95th percentile dropped from 550 ms to 200 ms; no user-facing errors
Emerging Trends in System Diagnostics
- AI-driven root-cause analysis that ingests logs and metrics to suggest fixes.
- Universal instrumentation standards (OpenTelemetry) for vendor-agnostic observability.
- Serverless and edge diagnostics to trace ephemeral functions and distributed workloads.
- Self-healing infrastructure that auto-scales or rolls back based on health signals.
- Chaos engineering combined with diagnostics drills to validate resilience under failure.
Final Takeaways
- Treat diagnostics as a first-class discipline: invest in instrumentation and runbooks up front.
- Build holistic observability: combine metrics, logs, and traces to see the full picture.
- Establish actionable alerts aligned to business impact, not just resource thresholds.
- Foster a blameless culture where diagnostics insights feed continuous improvement.
- Stay agile: adopt emerging standards (OpenTelemetry) and AI tools to accelerate root-cause analysis.
By embedding these System Diagnostics Best Practices into your operations, you’ll not only resolve issues faster but also build more predictable, resilient systems that scale with confidence.
Elevate Your Competence: Uncover Our Insights on Techno
Read Our Most Recent Article About Archival Theory: Principles for Managing Electronic Records!


