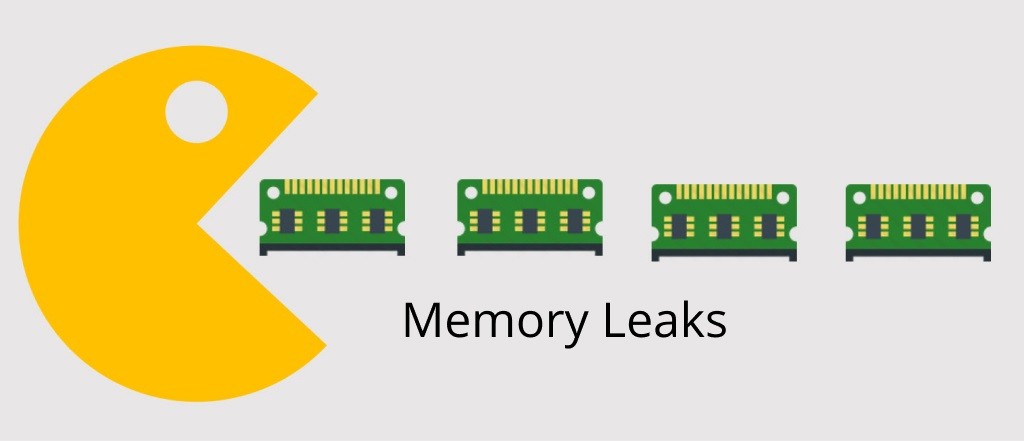
Jakarta, cssmayo.com – Memory Leak is a common and serious issue in software applications where memory that is no longer needed is not properly released. Over time, this causes the application to consume increasing amounts of memory, which can reduce performance, trigger crashes, and create instability across the system. In both small programs and large-scale platforms, memory leaks can quietly grow into major operational problems if they are not detected and resolved early.
What makes a Memory Leak especially challenging is that it often develops gradually rather than failing immediately. An application may appear to work normally at first, only to degrade after extended use or under repeated workloads. This makes memory leaks difficult to identify without careful monitoring, profiling, and analysis. Software, unfortunately, can be very polite about its problems right up until it decides to consume all available RAM like an unsupervised buffet guest.
Understanding Memory Leak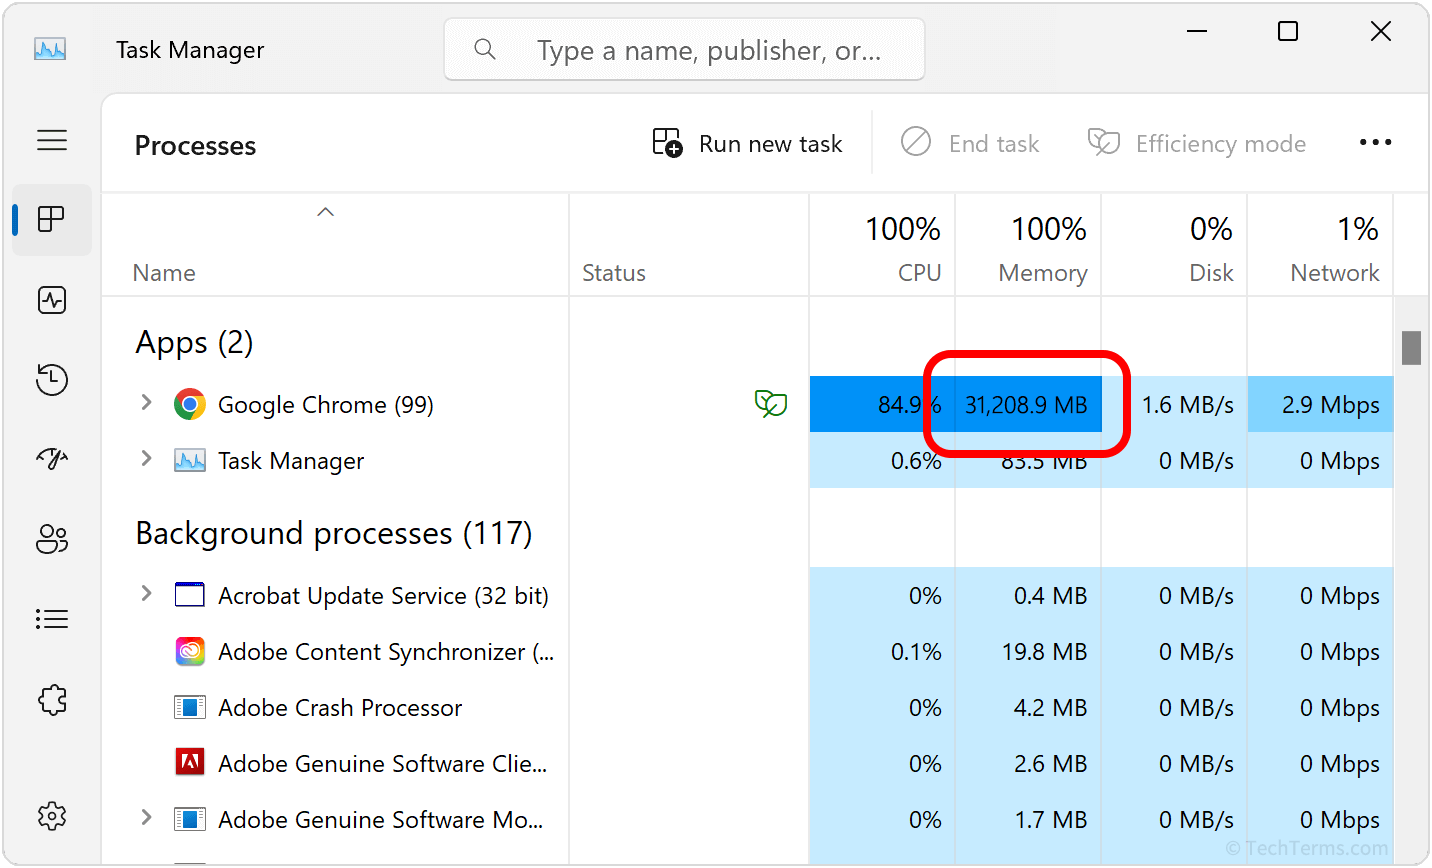
A Memory Leak occurs when a program allocates memory during execution but fails to release it after the memory is no longer required. As a result, the unavailable memory accumulates and reduces the amount of usable memory left for the application or system.
This issue is especially important in:
- Long running applications
- Server processes
- Desktop software
- Mobile applications
- Embedded systems
- High traffic backend services
In these environments, even a small leak can become significant over time.
Common Causes of Memory Leak
Understanding the causes of a Memory Leak is essential for prevention and resolution. Although the details depend on the programming language and runtime environment, several patterns appear frequently.
Unreleased Objects
Memory may remain allocated because objects are created but never properly removed or dereferenced.
Dangling References
Applications may continue holding references to data that is no longer needed, preventing garbage collection or cleanup.
Event Listener Accumulation
In some environments, event handlers remain attached and keep related objects alive longer than necessary.
Cache Mismanagement
Caches that grow without limits can behave like leaks even if they are technically still reachable.
Circular References
Some runtimes struggle to clean up objects that reference each other, depending on the language and memory model.
Native Resource Misuse
In lower-level languages or mixed environments, memory allocated manually may not be released correctly.
These causes show that a Memory Leak is often less about one dramatic bug and more about repeated small mistakes in memory lifecycle management.
Symptoms and Impact
The effects of a Memory Leak often become more visible over time as the application continues to run.
Common symptoms include:
- Increasing memory usage
- Slower application performance
- Frequent garbage collection activity
- Reduced responsiveness
- Unexpected crashes
- Out of memory errors
- System instability in extreme cases
These symptoms can affect both user experience and infrastructure reliability, especially in production environments.
Detecting a Memory Leak
Detecting a Memory Leak requires observation, tooling, and repeatable testing. Since the issue may develop gradually, effective detection often depends on comparing memory behavior across time.
| Detection Method | Description | Why It Matters |
|---|---|---|
| Memory profiling | Tracks allocation and retention patterns | Helps identify suspicious growth |
| Heap snapshots | Captures memory state at different times | Reveals unreleased objects |
| Monitoring tools | Observes runtime memory consumption | Detects long term trends |
| Stress testing | Repeats operations under load | Exposes leaks that appear over time |
| Code review | Examines object lifecycle logic | Helps find structural issues early |
Together, these methods provide a practical foundation for finding memory management problems before they escalate.
Resolving Memory Leak Issues
Once a Memory Leak is identified, the next step is to remove the root cause and confirm that memory behavior has stabilized.
Release Unused References
Ensure that objects and resources are no longer referenced when they are no longer needed.
Clean Up Event Handlers
Detach listeners, callbacks, and subscriptions that should not remain active indefinitely.
Manage Caches Carefully
Use size limits, expiration policies, and cleanup strategies for cached data.
Use Proper Resource Disposal
Close files, streams, buffers, connections, and native allocations correctly.
Refactor Object Lifecycles
Review how components are created, stored, reused, and destroyed to avoid unintended retention.
Retest After Fixes
Run profiling and stress tests again to verify that memory usage remains stable.
This process is important because fixing only the visible symptom without addressing the real cause can allow the leak to return.
Prevention Strategies
The best way to handle a Memory Leak is to reduce the chance of introducing one in the first place.
Useful prevention practices include:
- Writing clear lifecycle management logic
- Using automated testing for long running behavior
- Monitoring memory in staging and production
- Reviewing event and callback cleanup patterns
- Applying cache limits
- Using static analysis and profiling tools regularly
- Following language specific best practices for memory handling
Prevention is especially valuable in systems expected to run continuously or scale under heavy use.
Why Memory Leak Issues Matter
Memory Leak problems matter because they degrade reliability in ways that are often slow, expensive, and difficult to trace. They can waste infrastructure resources, damage user trust, and create failure conditions that only appear in production after prolonged uptime.
Their importance is especially clear in:
- Enterprise applications
- Real time services
- Mobile apps with limited resources
- Cloud systems with autoscaling costs
- Performance sensitive software
In these cases, poor memory management affects not only technical quality but also operational and financial outcomes.
Final Thoughts
Memory Leak issues are a serious form of software instability caused by memory that is allocated but not properly released. Although they may begin quietly, they can gradually reduce performance, increase resource usage, and lead to crashes or service disruption. Detecting and resolving these issues requires careful monitoring, profiling, and disciplined resource management throughout the application lifecycle.
The key takeaway is simple. A Memory Leak is not just a technical inconvenience. It is a critical memory management issue that can quietly undermine application performance, reliability, and scalability.
Explore our “”Techno“” category for more insightful content!
Don't forget to check out our previous article: Technology Transformation: Navigating Change in a Tech-Driven World